About
I was recently debugging the high latency of a website I am working on and I would like to share how I did that so it may be helpful to someone. In my case, the database was the bottleneck. So most part of this blog will be about debugging database latency.The website I am working on in on Elastic Beanstalk. The database is Postgres on RDS.
What causes high latency?
High latency can be caused by several factors, such as:
- Network connectivity
- ELB configuration
- Backend web application server issues including but not limited to:
- Memory utilization – One of the most common causes of web application latency is when most or all available physical memory (RAM) has been consumed on the host EC2 instance.
- CPU utilization – High CPU utilization on the host EC2 instance can significantly degrade web application performance and in some cases cause a server crash.
- Web server configuration – If a backend web application server exhibits high latency in the absence of excessive memory or CPU utilization, the web server configuration should be reviewed for potential problems.
- Web application dependencies – If a backend web application server exhibits high latency after ruling out memory, CPU, and web server configuration issues, then web application dependencies such as external databases or Amazon S3 buckets may be causing performance bottlenecks.
In this blog, I will not be covering how to solve the Network connectivity or the ELB configuration. If you think that is the issue please see the links 1 and 2 below to troubleshoot them.
Finding the cause of latency
Start by looking at the hardware your application is running on to see if it is causing the latency. See the CPU, Memory utilization and Disk usage in CloudWatch. CPU metric is available by default but other metrics like Memory is not but you can add it manually. You can even SSH into your instances and see the metrics. If you see any one of the metrics constantly being high you might want to look into upgrading your instance type or instance class. I have covered CPU and disk IO briefly in debugging database latency below.
If you see all these metrics are within normal range, the issue might be some external dependencies like the database.
If you think the reason for the slow load time of your website is static files like JS, CSS, images, videos etc, you should use a CDN(Content delivery network) like CloudFront.
Debugging database latency
CPU and storage
Check your CPU utilization. If you see it is constantly high or frequently it goes to full capacity it might be a good idea to look at your instance type and upgrade it if required. While selecting an instance type, keep in mind what your application needs(IO, CPU or memory).
Storage
If your database makes a lot of IO requests, you might want to upgrade the storage of your DB instance from general purpose SSD to provisioned IOPS SSD. For gp2 instances, the baseline IOPS provided are 100 IOPS up to 33GB of storage volume size and 3 IOPS per storage size from 34GB onwards. That is Volumes of 33.4 GiB and greater have a baseline performance of 10,000 IOPS.
How do know if you need more IOPS?
See the Disk Queue Depth metric of Cloud watch. As you might be knowing, DiskQueueDepth shows the number of I/O requests in the queue waiting to be serviced. These are I/O requests that have been submitted by the application but have not been sent to the device because the device is busy servicing other I/O requests. Higher values indicate that the number of processes waiting in the queue is more.
If your write throughput also increases when the Disk Queue Dept increases, this means that the database is making a lot of write requests(insert/update).
If your read throughput also increases when the Disk Queue Dept increases, this means that the database is making a lot of read requests(select).CPU Utilization
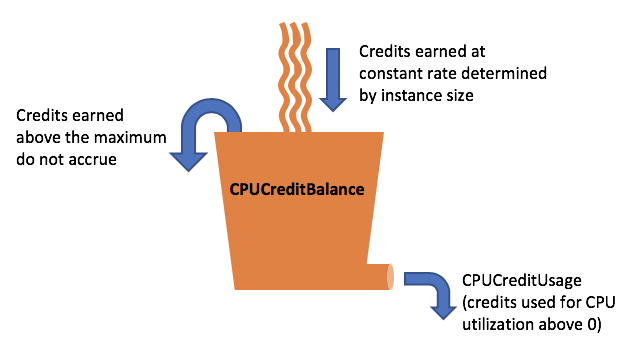
If you are using T2 instances, you get CPU credits per hour. See this link[3] to know how much CPU credits you get per hour. See your baseline CPU utilization.For e.g., a t2.large instance has two vCPUs, which earns 36 credits per hour, resulting in a baseline performance of 30% (18/60 minutes) per vCPU.
The CPU credit has depleted due to the CPU utilization running higher than the baseline of 30% over a period of time and using up the available CPU credits. That is, if a burstable performance instance uses fewer CPU resources than is required for baseline performance (such as when it is idle), the unspent CPU credits are accrued in the CPU credit balance. If a burstable performance instance needs to burst above the baseline performance level, it spends the accrued credits. The more credits a burstable performance instance has accrued, the more time it can burst beyond its baseline when more performance is needed.
So if the CPU credits are not much, your DB instance won't burst up more than its baseline. If this is the problem you are having look into upgrading the instance from T class to M or any other according to your needs.
Debugging Slow queries
This is one of the main reasons I have seen so far which results in database latencies. If you have inefficient queries or not indexed the tables properly you might see extremely high query execution times.
To see how much time each query is taking, you can look at the database logs. Note that logging of query execution times is turned off by default and you need to enable it in the parameter group of your database. Once enables, go to the logs and see how much time the queries are taking and identify the slow queries.
Once you have the slow queries run them in PGAdmin with the explain command. This might be different depending on the database you are using. I used this on a Postgres database. This will help you see what part of the query is taking time. If you see a sequential scan is going on on a large table, you might want to index that table on the search column. Creating indices on search columns would help bring down the query execution time a lot. For me, it brought down the time from a few seconds to less than 100ms.
If you are doing a lot of insert statements do a batch insert instead of inserting rows one by one. This can also bring down execution time a lot.
Enabling Enhanced Monitoring
Cloud watch collects statistics at every 60s interval, so if there is any resource spike within 60s, it might not show on Cloud watch. However, enhanced monitoring provides data points of much more granularity and give more insight. Thus there might be a point where the number of IOPS provisioned or the CPU spike might have gone even above the data points as shown by the cloud watch metrics.
Enable Enhanced Monitoring for your RDS instance as it will provide more granular data which will be helpful in analyzing the IOPS and CPU Credits of up to 5-6 secs.
Please note there is an additional cost associated with enabling enhanced monitoring.
View processes running during high CPU consumption
Along with the enhanced monitoring you can use the pg_stat_activity to view current processes running during high CPU consumption. This will help you in identifying queries that need optimization. Thus if process list of Enhanced monitoring tracks down PID of queries with increased CPU utilization then in real time you can map the PID of those queries from enhanced monitoring with the PID of the queries as shown by pg_stat_activity. The command is as follows :
Select * from pg_stat_activity;
See queries execution time in Postgres
You can also use pg_stat_statement view which lists queries by total_time & see which query spends the most time in the database_List queries with the total number of calls, total rows & rows returned etc.
Enable PG_STAT_STATEMENTS:
○ Modify your existing custom parameter group and set the following settings:
---------------------------------------------
shared_preload_libraries = pg_stat_statements
track_activity_query_size = 2048
pg_stat_statements.track = ALL
pg_stat_statements.max = 10000
---------------------------------------------
○ Apply the parameter group and restart the RDS Instance.
○ Run "CREATE EXTENSION pg_stat_statements" on the database you want to monitor.
Once PG_STAT_STATEMENTS is setup you can start watching the pg_stat_statements in following ways:
○ List queries by total_time & see which query spends the most time in the database:
------------------------------------------------------
SELECT round(total_time*1000)/1000 AS total_time,query
FROM pg_stat_statements
ORDER BY total_time DESC;
------------------------------------------------------
○ List queries with total no. of calls, total rows & rows returned etc:
----------------------------------------------------------------
SELECT query, calls, total_time, rows, 100.0 * shared_blks_hit /
nullif(shared_blks_hit + shared_blks_read, 0) AS hit_percent
FROM pg_stat_statements ORDER BY total_time DESC LIMIT 5;
----------------------------------------------------------------
○ List queries on 'per execution' basis & try to sample them over time:
-----------------------------------------------------------
SELECT queryid, query, calls, total_time/calls, rows/calls,
temp_blks_read/calls, temp_blks_written/calls
FROM pg_stat_statements
WHERE calls != 0
ORDER BY total_time DESC LIMIT 10;
-----------------------------------------------------------
4. Once you identify the culprit queries, run EXPLAIN or EXPLAIN ANALYZE for those statements and try to tune them by seeing the execution plan like we did above.
If you are having a hard time trying to solve the issue try contacting AWS support. I contacted them and they were really helpful. Keep in mind that this would take a couple of days.
- https://aws.amazon.com/premiumsupport/knowledge-center/elb-latency-troubleshooting/
- https://aws.amazon.com/premiumsupport/knowledge-center/elb-connectivity-troubleshooting/
- https://docs.aws.amazon.com/AWSEC2/latest/UserGuide/t2-credits-baseline-concepts.html
- https://www.postgresql.org/docs/9.2/static/monitoring-stats.html#PG-STAT-ACTIVITY-VIEW
It is really a great work and the way in which you are sharing the knowledge is excellent. aws training in omr | aws training in velachery | best aws training center in chennai
ReplyDeleteCloud Migration services
ReplyDeleteBest Cloud Migration Tool
If you see all these metrics are within normal range, the issue might be some external dependencies like the database. mens chains canada , mens chains australia ,
ReplyDeleteWe need a reliable and fast server for hosting our websites. However, reliable hosting companies in Asia normally provide packages that cost more. Therefore, we need to pick the trust-able hosting companies like WebAsroy that offers faster hosting packages in a cheap rate. https://onohosting.com/
ReplyDeleteReliable and Low Cost WordPress Web Hosting Provider in Sri Lanka. FREE SSL, 24/7 support. Cheap Web Hosting and Fast VPS, Web Hosting Sri Lanka.
ReplyDelete